An audiogram is a visual representation of a person’s hearing loss that shows the softest level a person can hear at different frequencies (or pitch). The audiogram is universally used by audiologists, hearing instrument specialists, and other hearing healthcare professionals.
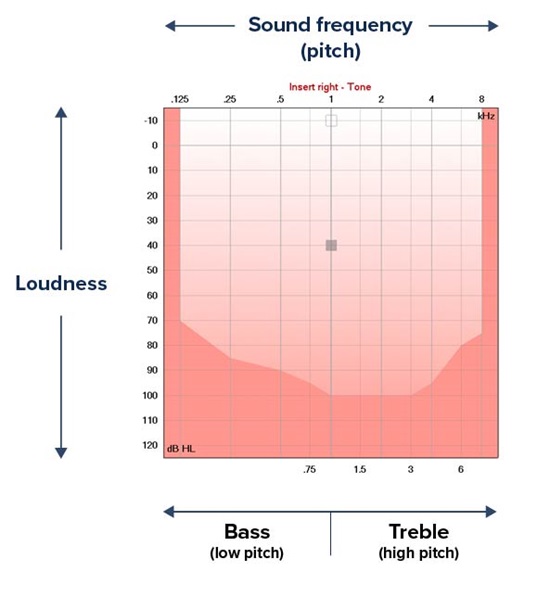
On the audiogram sample above, there are several elements to note:
Horizontal axis – sound frequency (pitch)
The horizontal axis of an audiogram shows what frequency (or pitch) is tested – Low pitch sounds (bass) to the left and high pitch sounds to the right (treble). You can think of this like a piano low pitch to high pitch.
Vertical axis – Loudness
The vertical axis shows the softest level sound on top traveling to the loudest level sound at the bottom. When you meet each axis together it shows what level you can hear at each specific frequency.
Right ear and left ear
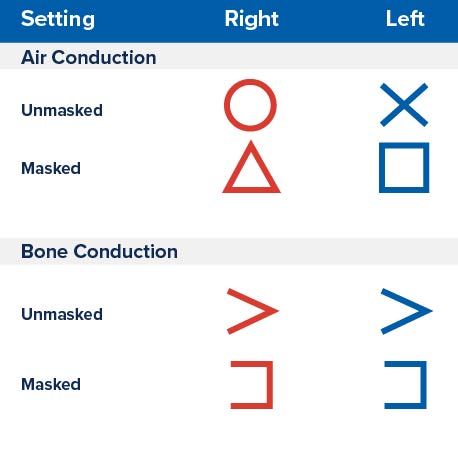
Your right ear and left ear are tested separately and shown on two separate audiograms or on the same one as two lines depending on who you see. The right ear is shown as a red circle o and the left ear is shown as a blue x.
Bone conduction
Bone conduction measures where your “permanent hearing lies,” or is testing your inner ear/hearing nerve. This will show the type of hearing loss that you have. You may see it marked on the graph like this > / < or like this [ / ].
Three different types of hearing loss:
Sensorineural hearing loss - this is the most common type of hearing loss a person will be diagnosed with. Most of the time, sensorineural hearing loss is related to age, genetics, and overall noise exposure over time. This type of loss cannot typically be medically managed by surgery and will be managed through hearing devices.
Conductive hearing loss - there are many different reasons why someone may have a conductive hearing loss. However, if you are diagnosed with this type of hearing loss, your hearing care professional will likely refer you to a physician such as an Ear Nose and Throat (ENT) specialist to further investigate the cause of your hearing loss. An ENT will see if there are other options to treat your hearing loss before moving forward with hearing devices.
Mixed hearing loss - this type of hearing loss is diagnosed when there is both a sensorineural component and a conductive component to your audiogram. This means there is both damage to your outer/middle ear and your inner ear (nerve of hearing). This type of hearing loss may also warrant you to see a physician such as an Ear Nose and Throat specialist.
Degrees of hearing loss
Many people believe that hearing loss can be diagnosed by a percentage of loss. However, hearing loss is diagnosed on a degree scale. The degrees of hearing loss go from mild, moderate, moderately severe, severe, and profound. Mild hearing loss is between 25 – 40 decibels, moderate 40 – 55 decibels, moderately severe 55 decibels – 70 decibels, severe 70 decibels – 90 decibels and profound is any hearing loss over 90 decibels.

All levels of hearing loss, up to and including some profound losses, may be treatable with hearing aids.
How different hearing loss configurations look on audiograms
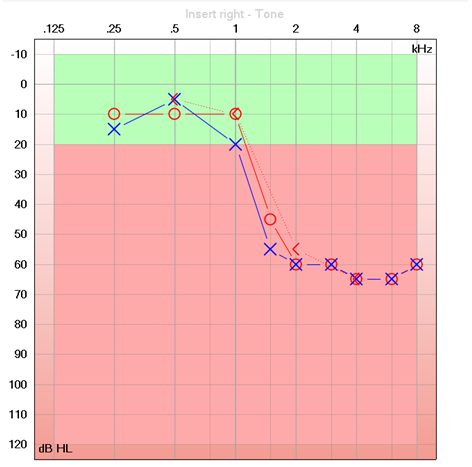
High-frequency hearing loss
High-frequency loss slopes downward on the right side of the audiogram, like the one below.
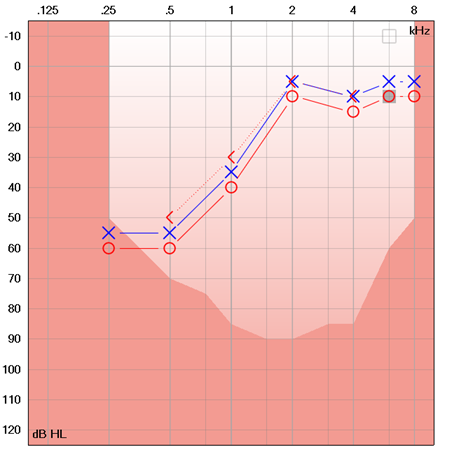
Low-frequency hearing loss
Low-frequency loss slopes upward from left to right, like this one:
Cookie bite (mid-frequency) hearing loss
Mid-frequency loss is called cookie bite because it looks like someone took a bite out of the audiogram!
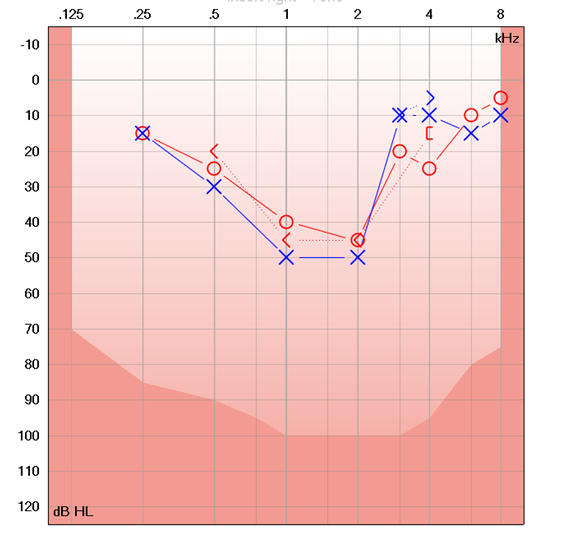
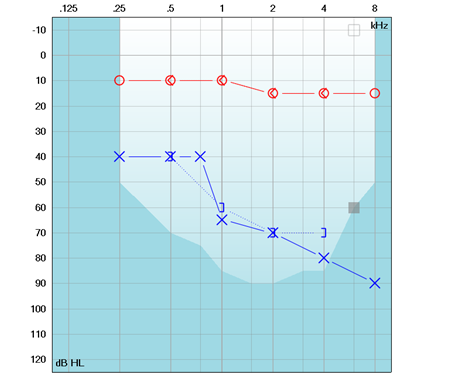
One-sided hearing loss
One-sided hearing loss has a large gap between the x’s and o’s on the audiogram graph
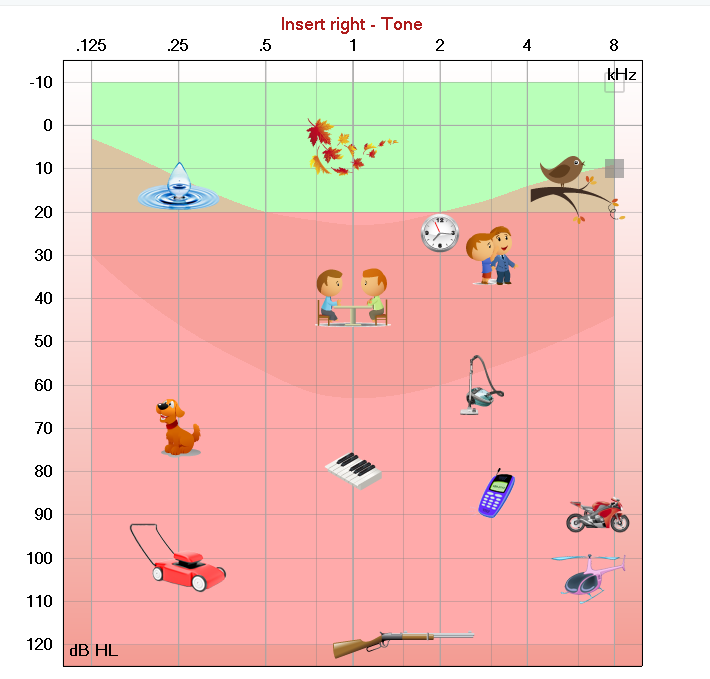
The speech banana
The speech banana is a visual representation of where speech sounds fall on an audiogram. It can be an excellent way to visualize and understand how hearing loss affects someone’s day to day experiences interacting with others. If someone has a mild low-frequency hearing loss, they may have trouble hearing v, z, m, d, b n and ng sounds (vowel sounds). A mild high-frequency loss can make hearing th, f, and s sounds more difficult (consonant sounds). And those with cookie bite loss, or mid-frequency hearing loss, have trouble with most other speech sounds as they fall in the middle of the banana.
Find out what your audiogram looks like when you schedule your complimentary hearing assessment at HearingLife.


